
Facts & Figures: Students
Facts & Figures provides a high-level overview of the University of Toronto through interactive dashboards. The dashboards include key metrics across a number of areas including rankings, students, student experience, research, finance, facilities, workforce, and advancement.
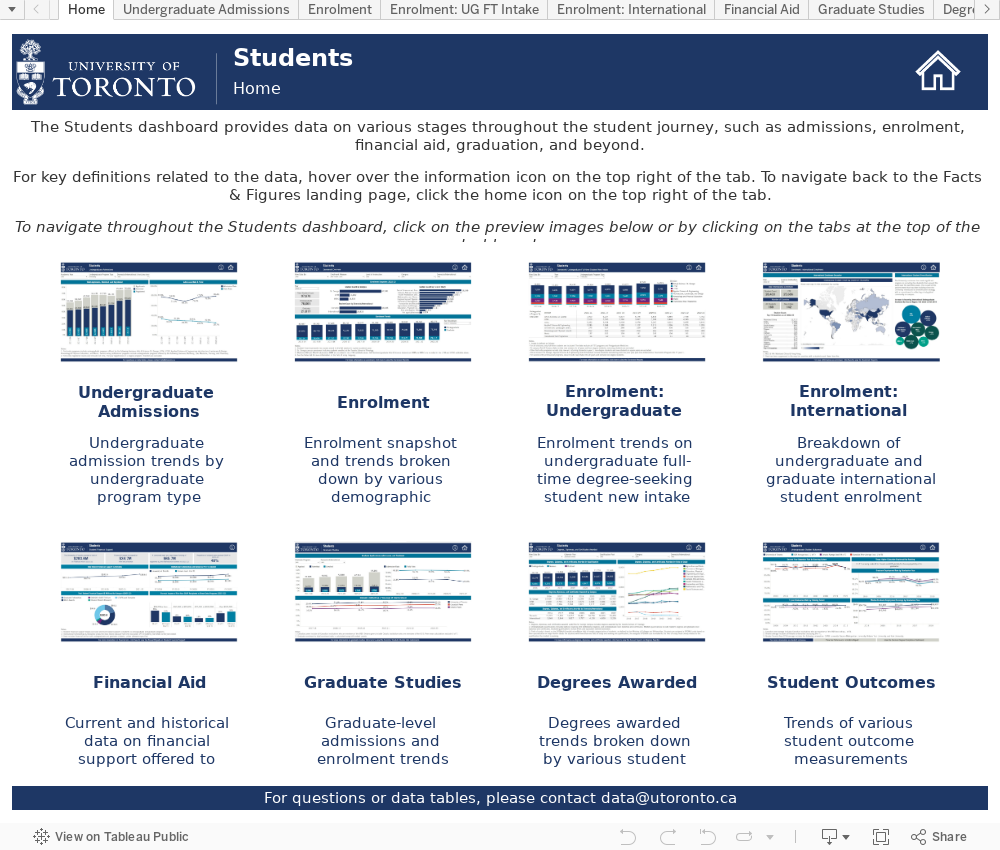
Students by University of Toronto
This dashboard has been designed to be as accessible as possible and to achieve compliance with the Accessibility for Ontarians with Disabilities Act (AODA). However, if you experience any barriers to accessing the information within, please email data@utoronto.ca and we will work with you to provide appropriate alternative formats and/or communication supports.
Display issues? Open the dashboard in a new window.